Table of Contents
- The Blind Spot
- Memory as a Security Data Plane
- What to Instrument
- The Metrics That Matter
- OpenTelemetry for Agent Memory
- The Tooling Landscape, and Its Gap
- Detecting Poisoning at Runtime
- Retrieval and Embedding Anomalies
- Behavioral Baselining and Drift
- Forensics and Auditing
- The Incident-Response Playbook
- SIEM Integration and Compliance
- Conclusion: You Cannot Defend What You Cannot See
The Blind Spot
Ask a team running agents in production what they monitor, and you will hear a familiar list: token usage, latency, tool-call success rates, model output quality, maybe a hallucination score. All of it points at two things, the model and the tools. Almost none of it points at the layer between them: the long-term memory that persists across sessions and users.
That gap is not cosmetic. It is exactly where the most dangerous failures hide, because a poisoned or corrupted memory does not announce itself. It produces behavior that looks, to every dashboard you have, like the model having a bad day. A teammate of this problem has a name in the research: the Misattribution Gap. Memory-layer compromise is statistically indistinguishable from model misalignment, so teams "fix the model," tune the prompt, swap to a newer version, while the poisoned record sits untouched in the store and re-fires next week against the next user.
The thesis of this article follows directly: agent memory is a security data plane, and it has to be instrumented like one. You cannot respond to what you cannot attribute, and you cannot attribute what you never observed. Everything below is how to watch the memory plane, detect when it goes wrong, prove what happened after the fact, and wire it all into the systems your security team already runs.
Memory as a Security Data Plane
Standard LLM observability treats a request as a single trace: prompt in, tokens out, cost and latency recorded. That model is blind to memory because memory is not a request. It is state that lives between requests, written by one interaction and read by another, often days later and often for a different person.
Three properties make it a distinct plane that needs its own instrumentation:
- It is persistent. A problem written today fires at an unknown future time, so point-in-time request monitoring misses the link between cause and effect entirely.
- It crosses principals. One user's write can surface in another user's session. The interesting security events are relationships between interactions, not events within one.
- It carries authority. Retrieved memory is frequently promoted into the system context, so a corrupted record influences decisions with more weight than ordinary user input.
Observability for this plane is therefore not "add memory to the trace." It is treating every write, every retrieval, and every eviction as a security-relevant event with its own provenance, its own metrics, and its own detections.
What to Instrument
Instrument the full memory lifecycle, the same write, store, retrieve, forget loop the rest of this series is built on, and emit a span at each stage. The non-negotiable detail is that provenance and trust labels are attached at write time, when you still know where the content came from, and carried through every later span. Attribution after an incident is only possible if the breadcrumbs were dropped before it.
Concretely, every memory operation should record:
- On write: the source and channel (user, tool, MCP server, document), the principal, a timestamp, and the initial trust label.
- On retrieve: which records were returned, their trust and age, the query, the caller and tenant, and whether the result fed a consequential action.
- On forget/evict: what was removed and why (policy, decay, or quarantine).
This is the raw material for both the live metrics and the post-incident forensics. Skip it at write time and no amount of clever detection later can reconstruct what you did not capture.
The Metrics That Matter
A handful of metrics turn that instrumentation into something an SRE or analyst can alert on. The most useful ones are memory-specific, not generic LLM metrics:
| Metric | What it tells you | Watch for |
|---|---|---|
| Memory growth rate | How fast the store is accumulating | Sudden spikes (bulk injection) |
| Retrieval hit rate | Fraction of queries that return anything | Near-zero means the agent is flying blind |
| Trust-score distribution drift | Whether stored trust is shifting over time | Quiet decline (slow poisoning or decay) |
| Eviction rate | How much is being forgotten | Too low means context rot; too high means amnesia |
| Write-channel mix | Which channels are writing memory | An untrusted channel suddenly writing a lot |
| Cross-tenant access attempts | Reads reaching across isolation boundaries | Any nonzero count is an incident |
| Retrieval-to-action ratio | How often retrieved memory drives a tool call | Spikes on consequential tools |
| Record age at retrieval | How old the surfaced memories are | A dormant record waking up (sleeper trigger) |
| Embedding hubness | How often one record is a nearest neighbor for many queries | A hub forming (one record influencing everything) |
The last one deserves emphasis, because it is the most actionable metric most teams have never heard of. Hubness measures how often a single stored record shows up as a nearest neighbor across unrelated queries (its reverse-kNN frequency). In a healthy vector store, influence is distributed. When one injected record becomes a hub, it quietly steers answers to many different questions, which is precisely the signature of an embedding-space poisoning attack. Monitoring reverse-kNN frequency catches that before the record has influenced thousands of responses.
OpenTelemetry for Agent Memory
You do not need a proprietary format for any of this. The industry has standardized on OpenTelemetry's GenAI semantic conventions, finalized in late 2025, with vector-database conventions in scope. The practical model is four span types per agent turn: an LLM span, a tool span, a memory span, and an orchestration span tying them together. The memory span is the one most current setups omit, and it is the one this whole article is about.
The advantage of standardizing on OTel is portability: the same memory spans flow to whatever backend you choose, and, as we will see, to your SIEM. Emit a memory span on every retrieve and write, attach the provenance and trust attributes, and you have turned an opaque internal operation into a first-class, queryable signal.
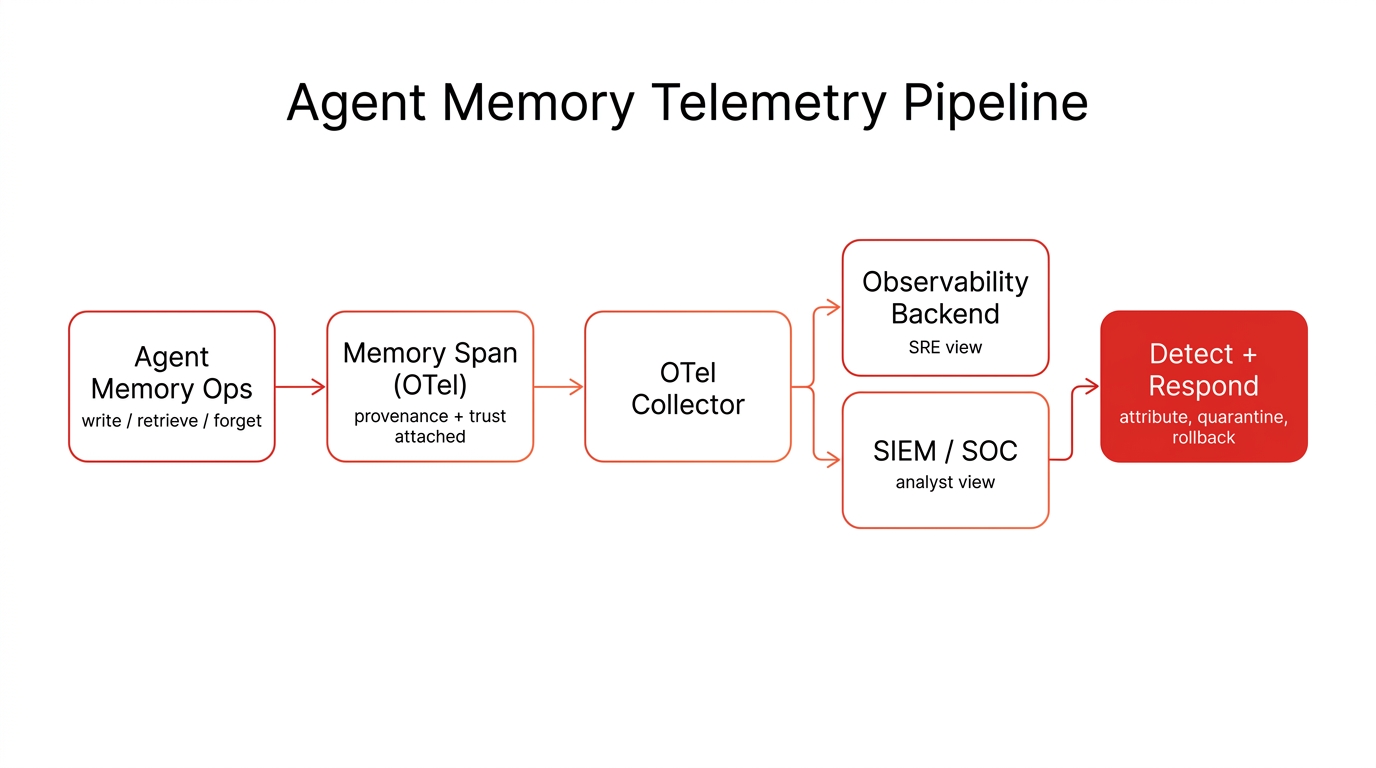
Figure 1: The agent memory telemetry pipeline. One OpenTelemetry feed, dual-exported to the SRE backend and the SIEM.
The Tooling Landscape, and Its Gap
The LLM-observability ecosystem is healthy: Langfuse, Arize Phoenix, OpenLLMetry, and LangSmith all do a good job of capturing cost, latency, and output quality, and several can ingest OTel traces. Use them; they solve the operational half of the problem.
The gap to be clear-eyed about is that none of them models memory as a security plane. They will show you that a retrieval happened and how long it took. They will not tell you that the retrieved record came from an untrusted channel, that its trust score has been quietly drifting, or that it has become an embedding hub. The closest mainstream feature is Phoenix's embedding-drift view, which is useful but built for quality and model-drift, not adversarial poisoning. The takeaway for a security team: the observability tools give you the pipes, but the memory-as-security-plane detections are something you currently have to add yourself on top of the OTel data.
Detecting Poisoning at Runtime
Detection splits into two questions: is a specific record malicious, and is the system's behavior drifting. Start with records.
The anchor result here is MEMSAD, which formalizes memory-poisoning detection and, importantly, shows that sloppy evaluation badly understates the threat (a faithful evaluation protocol raised measured attack success roughly fourfold). The deeper lesson comes from work like A-MemGuard: auditing a record in isolation does not work, because the malice is context-activated. A poisoned memory often looks completely benign on its own and only becomes harmful when retrieved alongside a particular query or topic. That means a detector that scores each record by itself will pass the payload. Effective detection has to consider the record in the context that triggers it, which is harder and is why runtime detection, not just ingest-time filtering, is necessary.
Retrieval and Embedding Anomalies
The second class of detection watches the retrieval layer itself, and hubness is the centerpiece. Tools and techniques in this space (hubness scanning, admission-time control that screens a candidate before it is ever stored, and "black-hole" detection of records that absorb disproportionate retrieval traffic) all target the same failure: one record gaining outsized influence over what the agent recalls. The strongest version is admission-time control, screening a new memory against existing query patterns before it is committed, so a would-be hub is quarantined at the door rather than discovered after it has shaped a month of answers. If you can afford only one new retrieval-layer detection, monitor reverse-kNN frequency and alert when any record crosses a hubness threshold.
Behavioral Baselining and Drift
Records and retrievals are the micro view. The macro view is the agent's behavior over time. Baselining approaches learn what the agent's normal operation looks like (which tools it calls, in what sequences, with what memory backing) and alert on deviation; recent work formalizes this with automaton-based "firewalls" and temporal-logic runtime monitors that flag when an agent's action sequence violates a learned or specified policy.
This view is essential because of a failure mode the series has flagged before: not all memory degradation is an attack. Longitudinal studies show an agent's safety posture can erode gradually through ordinary use, confirmation boundaries weakening and autonomy expanding over many sessions. Behavioral baselining catches the slow drift that record-level detection, looking for a discrete malicious entry, will miss entirely.
Forensics and Auditing
When something does go wrong, the question is "which memory caused this, and how did it get in?" Answering it is the forensics problem, and it is where instrumentation pays off.
Two anchors. MemAudit does post-hoc causal attribution, tracing a bad action back to the specific record that drove it, which is the direct antidote to the Misattribution Gap. VCT (Verifiable Conversation Transcripts) provides tamper-evident, Merkle-structured logs of the agent's interaction history at roughly one percent overhead, so the record of what happened cannot itself be quietly altered. A related strand, "notarized agents," makes the sharp point that an agent's self-reported logs are not trustworthy evidence (a compromised agent can lie about its own history), so high-assurance setups want receiver-attested receipts, logs confirmed by the counterparty rather than the agent alone.
Two honest caveats keep this from being oversold. Provenance metadata is malleable unless it is cryptographically anchored, as the security-engineering piece in this series detailed. And using an LLM as the judge to attribute blame is unreliable on its own (one study put naive LLM-judge attribution accuracy around fourteen percent), so attribution needs the structured signals from your instrumentation, not just a model's after-the-fact opinion.
The Incident-Response Playbook
Put detection and forensics together and you get a repeatable response, and the single most important habit is the first one: check the memory before you blame the model. The playbook:
- Triage with the Misattribution Gap in mind. When an agent misbehaves, treat "the memory was poisoned" as a first-class hypothesis, not an afterthought.
- Attribute. Use causal attribution and your provenance logs to find the specific record and the channel that wrote it.
- Quarantine. Isolate the record so it stops being retrieved, without yet destroying evidence.
- Rollback. Restore the affected memory to a known-good version (which requires you to have versioned it).
- Eradicate. Close the write channel that allowed the injection.
- Post-incident. Feed what you learned back into detections and architecture.
Read that list again and notice it doubles as an architecture-requirements list: it is impossible without versioned memory, write-time provenance, and tamper-evident logs. The ability to respond is designed in before the incident, or it is not there at all.
SIEM Integration and Compliance
None of this should live in a silo your security operations center cannot see. The clean integration path uses the OpenTelemetry Collector to dual-export: send the memory telemetry to an AI-native observability backend for the SRE view, and to the SIEM for the analyst view. Once the spans are in the SIEM, the detections become ordinary correlation rules an analyst can own:
- An untrusted write channel exceeding its normal write rate.
- A record crossing the hubness threshold.
- Any cross-tenant retrieval attempt.
- Trust-score distribution drifting downward.
- A spike in retrieval-to-action on consequential tools.
There is a compliance dividend too. Regimes like the EU AI Act (Article 12) already require automatic record-keeping and retention for high-risk AI systems. The same memory telemetry that powers detection satisfies much of that logging obligation, so the security investment and the compliance investment are largely the same investment.
Conclusion: You Cannot Defend What You Cannot See
The memory plane is the part of an agent that persists, crosses users, and carries authority, and it is the part almost no one is watching. That blind spot is what lets memory attacks masquerade as model failures and survive for weeks. Closing it is not exotic: instrument the write, store, retrieve, and forget lifecycle with provenance attached at write time; standardize on OpenTelemetry's GenAI conventions so a memory span is a first-class signal; add the memory-specific detections (hubness, write-channel anomalies, cross-tenant reads, trust drift) that the off-the-shelf tools do not; keep tamper-evident logs so forensics is possible; and wire it all into the SIEM your analysts already use.
Do that, and the next time an agent misbehaves you can ask the question that actually matters, which memory caused this and how did it get in, and get an answer. Treat the memory plane as observable, and the Misattribution Gap closes: the poisoned record stops being an invisible recurring mystery and becomes a detected, attributed, contained incident like any other.
Sources and further reading: the Misattribution Gap (arXiv:2605.22842); MEMSAD (arXiv:2605.03482); A-MemGuard (arXiv:2510.02373); embedding hubness monitoring (arXiv:2602.22427, arXiv:2606.19692); behavioral baselining (arXiv:2604.26274, arXiv:2509.20364); MemAudit (arXiv:2605.23723); Verifiable Conversation Transcripts (arXiv:2606.23003); notarized agents (arXiv:2606.04193); attribution reliability (arXiv:2606.08275); OpenTelemetry GenAI semantic conventions; EU AI Act Article 12. Companion pieces: the agent memory explainer, the memory-architectures guide, the agent-memory attack-surface article, and the secure-memory engineering guide.